Top 10 gainers and losers
Data shown may be delayed or estimated. Not investment advice — verify with NSE/BSE official sources before acting.
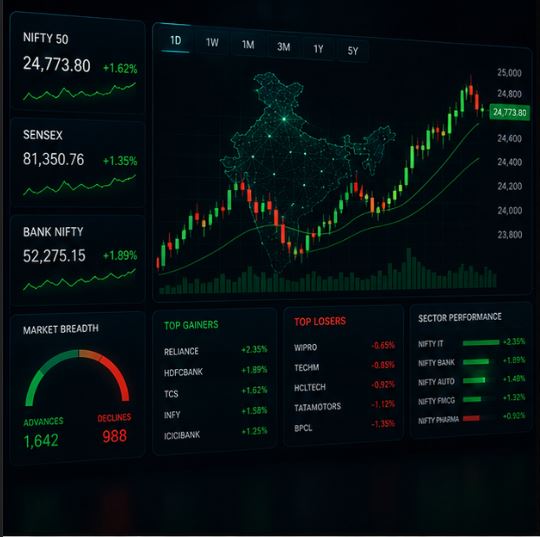
Real-time market intelligence
Track live market momentum, sector rotation, and institutional activity through a clean real-time intelligence platform.
For informational purposes only. Not investment advice. Data may be delayed or estimated. Consult a SEBI-registered advisor before investing.
Data shown may be delayed or estimated. Not investment advice — verify with NSE/BSE official sources before acting.
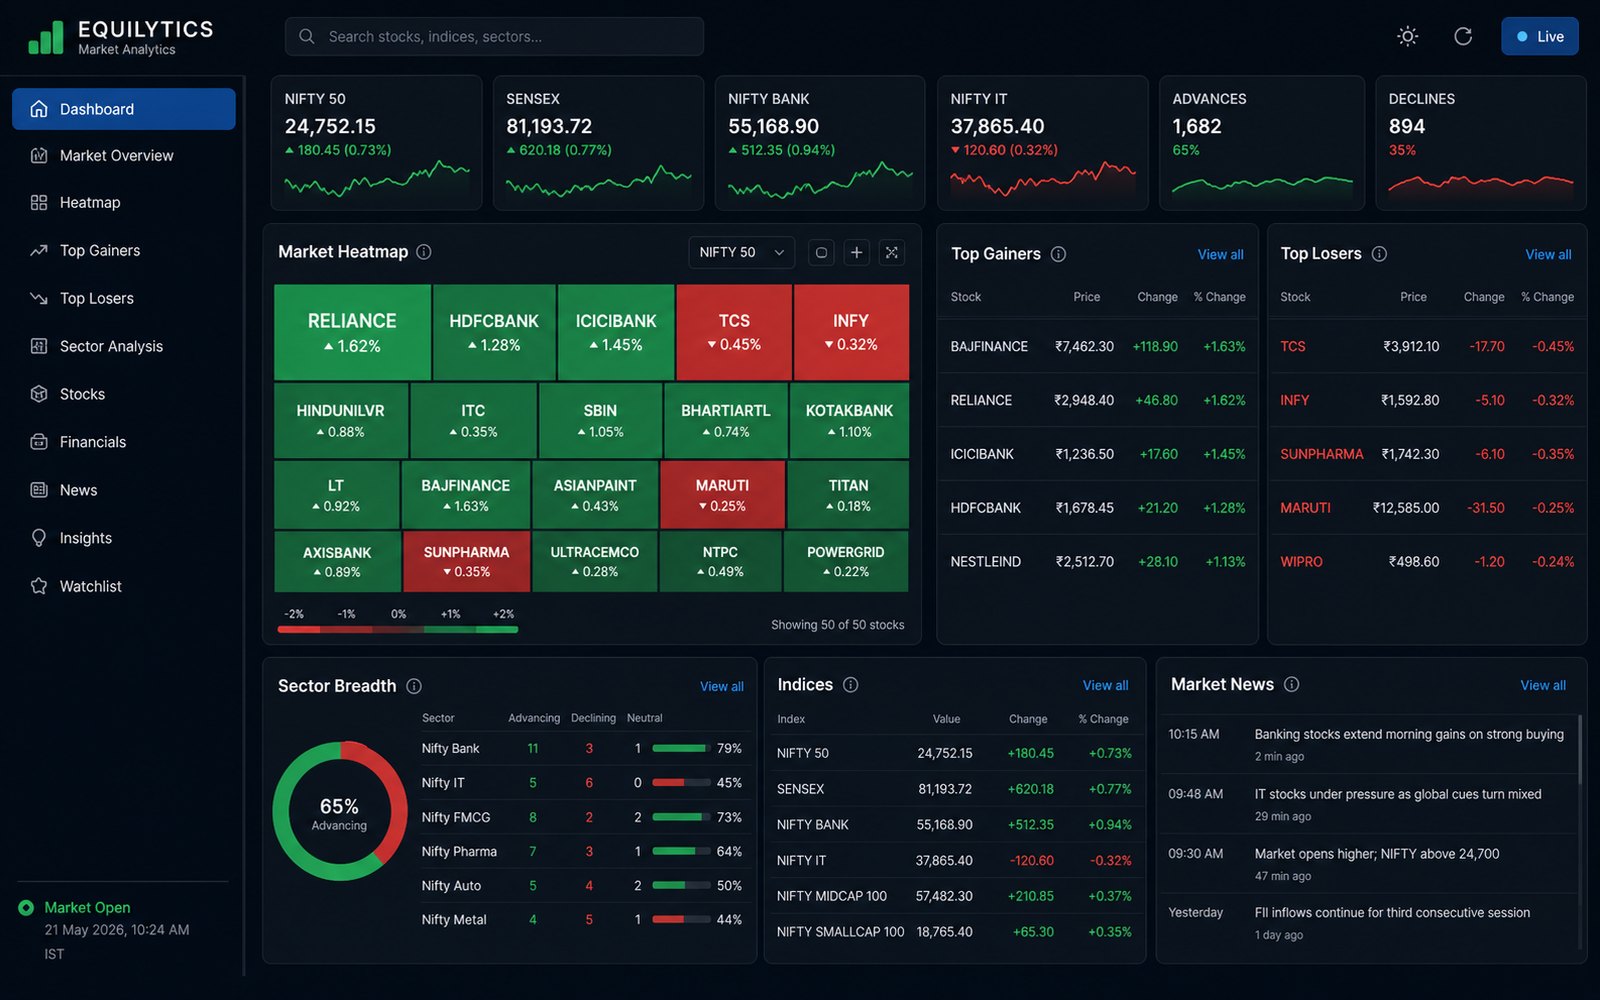
Equilytics provides a unified, real-time view of Indian equity markets — covering NIFTY 50, Bank NIFTY, FIN NIFTY, NIFTY Midcap, and SENSEX. The platform displays live prices, percentage changes, trading volumes, advancing/declining breadth, and sector rotation signals in one clean dashboard. Market data refreshes automatically during NSE and BSE trading hours (Monday–Friday, 9:15 AM – 3:30 PM IST).
NIFTY 50 HEATMAP
The Equilytics heatmap replaces crowded tables with a single color-coded view. Each tile is one stock — green means it's up, red means it's down. Color intensity shows how big the move is. Switch between NIFTY 50, Bank NIFTY, Midcap and sector-specific views in one click. Filter by cap size or price action signal.
Learn how to read the heatmap →Dark green = strong gainer. Dark red = heavy loss. Light shades = moderate moves.
Banking, IT, Auto, Energy, FMCG, Pharma, Metal, Realty — any sector in isolation.
NIFTY 50, Bank NIFTY, FIN NIFTY, Midcap 150, SENSEX and all-NSE.
MARKET MOVERS
Every trading day Equilytics ranks all tracked NSE stocks by absolute percentage movement, volume spike, and sector breadth — helping you catch momentum early and see where money is flowing.
Stocks posting the biggest % gains on NSE — ranked live, updated every few minutes. Sort by sector, cap size, or momentum signal.
See top gainers →Stocks with the sharpest declines — useful for support analysis, contrarian setups, and identifying oversold conditions.
See top losers →Watch capital rotate between Banking, IT, Energy, FMCG and other sectors in real time with breadth and donut breakdowns.
Sector analysis →WHY EQUILYTICS
Full access to heatmap, market data, gainers, losers and company financials — no registration needed.
Built specifically for Indian equities. All indices, sectors and data sources calibrated for NSE and BSE markets.
View P&L, balance sheet, cash flow and ratios (P/E, ROE, ROCE) for any NSE-listed company — sourced from Screener.in and NSE filings.
No clutter, no ads. Just the data you need — heatmap, breadth, movers and financials in one place.
FAQ
Financial statements
Annual figures
Loading news links and summaries
Open, high, low, close snapshot
Market and valuation snapshot
Disclaimer: This dashboard is for information only and is not investment advice. Verify figures with exchange filings, company annual reports, and your financial advisor before making decisions.